A rotary screw compressor on a gas gathering line is not a pump in a water treatment plant. The physics are similar enough that vibration analysis applies, but the consequences of failure and the fault patterns you're watching for differ enough that a generic condition monitoring approach frequently misses the early warning signs that matter most in upstream and midstream operations.
We've worked through compressor monitoring on several projects and want to lay out what we've learned specifically about this asset class — what faults show up in the vibration spectrum before they become mechanical failures, where temperature data adds signal that vibration alone misses, and what a realistic P-F window looks like for the most common failure modes.
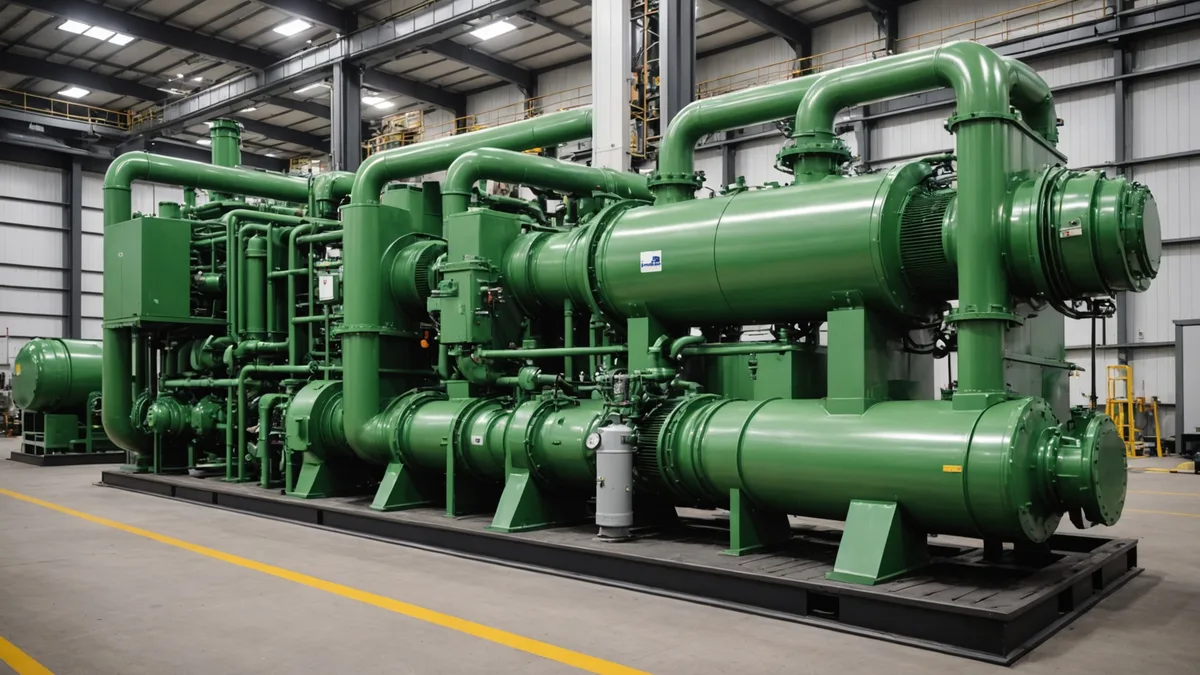
Why Compressors Are a High-Stakes Asset
The cost structure for compressor failures differs from most rotating equipment. When a centrifugal pump fails in a plant, you lose throughput on that line and potentially trigger a process upset. When a gas gathering compressor goes down, you may lose compression across an entire well pad — which in some configurations means you can't bring gas to pipeline pressure and the wells either back-pressure or shut in entirely.
Unplanned downtime costs in midstream compression can reach $40,000–$90,000 per day depending on throughput and spot gas prices, and that's before you factor in emergency service dispatch, parts on rush order, and the secondary damage that often accompanies a compressor failure that runs to the end rather than being caught mid-P-F curve. The well-pad case is even more acute: lost production is lost revenue with no recovery path.
This is why compressor condition monitoring justifies a higher sensor density and more frequent data collection than some other asset classes. You're not just protecting a piece of equipment; you're protecting the throughput of everything upstream of it.
The Primary Fault Patterns: What the Spectrum Shows
For rotary screw and reciprocating compressors, the fault signatures we watch most closely are rotor/shaft imbalance, bearing defect frequencies, coupling misalignment, and valve wear. Each has a distinct spectral fingerprint.
Rotor Imbalance and 1X Synchronous Components
Rotor imbalance shows up as an elevated 1X component — that is, a peak at running speed (RPM/60 in Hz) in the radial direction. On a rotary screw compressor running at 3,600 RPM, that's a 60 Hz peak. Clean imbalance appears as a sharp, dominant 1X with minimal harmonics. If you see elevated 1X alongside elevated 2X, that's more consistent with shaft bow or mechanical looseness. The distinction matters because the corrective action is different: imbalance correction requires balancing the rotor; shaft bow or looseness requires inspection of fits, keys, and bearing housing.
Bearing Defect Frequencies (BPFO / BPFI / BSF / FTF)
This is where compressor monitoring gets specific. Bearing outer race defect frequency (BPFO), inner race defect frequency (BPFI), ball spin frequency (BSF), and fundamental train frequency (FTF) are all calculable from bearing geometry and running speed. On a compressor operating under high radial load — as rotary screws often do, especially with belt-driven configurations — you're most likely to see BPFO first, since the outer race carries load continuously. BPFI tends to appear later in the degradation progression or in floating-race configurations.
The early-stage bearing signature is typically subtle: slight elevation at the defect frequency, often with sidebands at 1X (shaft speed). As the defect progresses, the peak grows and the sideband count increases. By the time you hear grinding or feel heat in the housing, you're already at the late P-F stage — there's still time to schedule, but the margin is narrow. Catching it at the early sideband stage gives you the 3-6 week window.
Coupling Misalignment
Misalignment between the compressor shaft and the driver (whether motor, engine, or gearbox) typically presents as elevated 2X radial vibration, often with axial vibration also elevated at 1X and 2X. Angular misalignment tends to produce more axial energy; offset (parallel) misalignment tends to dominate at 2X radial. In practice, you often see a mix.
The diagnostic value here is directional: if you see 2X rising over several weeks of trend data, that's a different maintenance action than if 2X appeared suddenly after a belt change or coupling replacement. Context in the trend history matters as much as the instantaneous spectral reading.
Valve Wear on Reciprocating Compressors
Reciprocating compressors add a fault mode that rotary screws don't have: valve wear and failure. Valve faults show up in two ways. First, in the vibration signature at higher frequencies — valve events produce distinct time-domain impulses that show up as broadband high-frequency energy when a valve is leaking or sticking. Second, and more reliably, through pressure differential monitoring: a leaking suction or discharge valve produces a detectably different pressure pattern across the compression cycle than a healthy valve.
We've found that for recips, coupling vibration data with cylinder pressure trends gives a much more reliable early warning than vibration alone. It's an argument for deploying both vibration and pressure sensors on this equipment class rather than relying on vibration only.
Temperature Data and What It Adds
Oil temperature monitoring on lubricated compressors is a separate data stream from vibration, and it catches fault modes that vibration misses until they're quite advanced. Bearing oil film degradation, for example, can elevate bearing housing temperature by 8–15°C before the vibration signature changes significantly. Oil injection temperature trending on rotary screws is particularly useful: a gradual rise in discharge oil temperature at constant load usually indicates the oil is losing its heat capacity, either through degradation or through a cooler efficiency problem.
The important distinction is rate of rise versus absolute temperature. A compressor running at 80°C discharge temperature is fine if it's been at 80°C for six months. A compressor that has risen from 72°C to 80°C over three weeks at constant load is telling you something different. This is why we track temperature trends rather than threshold alerts in isolation.
A Plausible Monitoring Scenario
Consider a midstream gas gathering operator running four rotary screw compressors on a Colorado DJ Basin wellpad, each motor-driven at 3,600 RPM, monitored continuously with triaxial accelerometers on both drive-end and non-drive-end bearings. At week 3 of monitoring, Fleetpio's daily health scoring flags a gradual rise in the BPFO frequency band on one unit's drive-end bearing, with an associated 1X sideband appearing — health score drops from 84 to 71 over two weeks. Oil temperature at that bearing housing has risen 6°C over the same period.
That's a maintenance work order created automatically, pushed to their CMMS, scheduled for the following weekend during a planned pigging run when compression is reduced anyway. The technician replaces the drive-end bearing, inspects the coupling, finds no secondary damage. Total planned downtime: 6 hours. Estimated unplanned scenario: compressor failure mid-week, 36–48 hours to get a service team and parts on-site, $50,000+ in lost throughput and emergency costs. The P-F window in that case was approximately 4 weeks — wide enough for comfortable scheduling, narrow enough that a monthly inspection cycle would have missed it entirely.
Sensor Placement Specifics
For rotary screw compressors, our standard deployment is four accelerometer nodes: drive-end bearing (radial, horizontal), drive-end bearing (axial), non-drive-end bearing (radial), and a fourth on the gearbox if applicable. Temperature sensors are co-located with the drive-end and non-drive-end bearing positions, plus one on the oil injection line return. For reciprocating compressors, we add pressure transducers on suction and discharge per cylinder.
On gear-driven compressors, gear mesh frequency (GMF) monitoring adds another layer. GMF is calculated as the number of teeth multiplied by shaft RPM — for a 40-tooth pinion at 1,800 RPM, that's 1,200 Hz. Sidebands at 1X around GMF indicate gear wear; sidebands at shaft speed indicate eccentricity. This is higher frequency than standard bearing analysis, so it requires either a sensor rated to 10 kHz+ or a separate high-frequency node.
What Condition Monitoring Doesn't Replace
We're not saying continuous vibration monitoring eliminates the need for oil analysis or physical inspection. Oil particle counting catches contamination from seal degradation that doesn't produce a significant vibration change until the damage is already done. Physical inspection catches external issues — corrosion on piping connections, environmental debris accumulation near air intakes, soft-foot on the baseplate — that no sensor array captures remotely.
The right framing is that continuous vibration and temperature monitoring extends your early warning window for the failure modes that have a clear spectral or thermal signature. That's most bearing failures, most imbalance/misalignment problems, and most thermal degradation events. It doesn't cover every failure mode, and it doesn't replace the judgment of a reliability engineer who looks at the equipment quarterly. What it does is ensure that the quarterly inspection is confirming health you already understand, rather than discovering a problem you didn't know was developing.
For compressors in oil and gas operations — where the cost of an unplanned failure is high enough that the monitoring investment pays back on a single avoided event — continuous condition monitoring is the baseline, not the advanced option.